

In today’s digital marketplace, understanding your customers’ behavior is the key to success. In this data-driven era, businesses need a powerful tool: Site Search & Collection Analytics. By diving into the insights provided by these analytics, you can unlock a treasure trove of information about your shoppers’ behavior.
Site Search & Collection Analytics: How data collection works
Site search and collection analytics offer valuable insights beyond product and keyword preferences, enabling website optimization, improved offerings, and enhanced customer experiences that boost sales. These analytics reveal eight crucial aspects of your customers’ behavior.
1. Search Behavior
Search behavior analytics provide insights into what users are searching for on a website, including popular search queries and frequently searched keywords. This data is essential for understanding customer interests and preferences.
Additionally, it’s crucial to monitor searches without clicks and queries that yield no results. These metrics help identify if customers are finding what they’re looking for or if improvements are needed in search result pages.
High-volume search terms can be optimized by adding synonyms or implementing merchandising rules to enhance search performance and keep users engaged.
2. User Engagement
User engagement analytics provide valuable insights into how users interact with search results and collections. This includes analyzing click-through rates (CTRs) to determine which products or content are most appealing to users. This data helps optimize the presentation and positioning of items to boost engagement and conversion rates.
When assessing collection page performance, it’s essential to consider key metrics such as:
- Total revenue from collections: This metric calculates the income generated from filter and search events within a specific collection over defined periods.
- Order count of a collection: This measurement indicates the number of orders resulting from customer use of search or filter functions within a given collection over specified time ranges.
- Collection conversion rate: This indicator reveals how likely customers are to make purchases from a particular collection when using search and filter options within specific date ranges. These insights can help refine collection strategies and enhance user engagement.
3. Filters and Sorting
Analyzing how users utilize filters and sorting options can reveal their preferences for refining search results. This information can guide you in improving your filtering options or suggesting relevant filters to users.
Monitoring the rate at which users abandon searches or filter selections can signal issues with your website’s usability or the relevance of the search results.
4. Navigating Categories: Insights into Interests
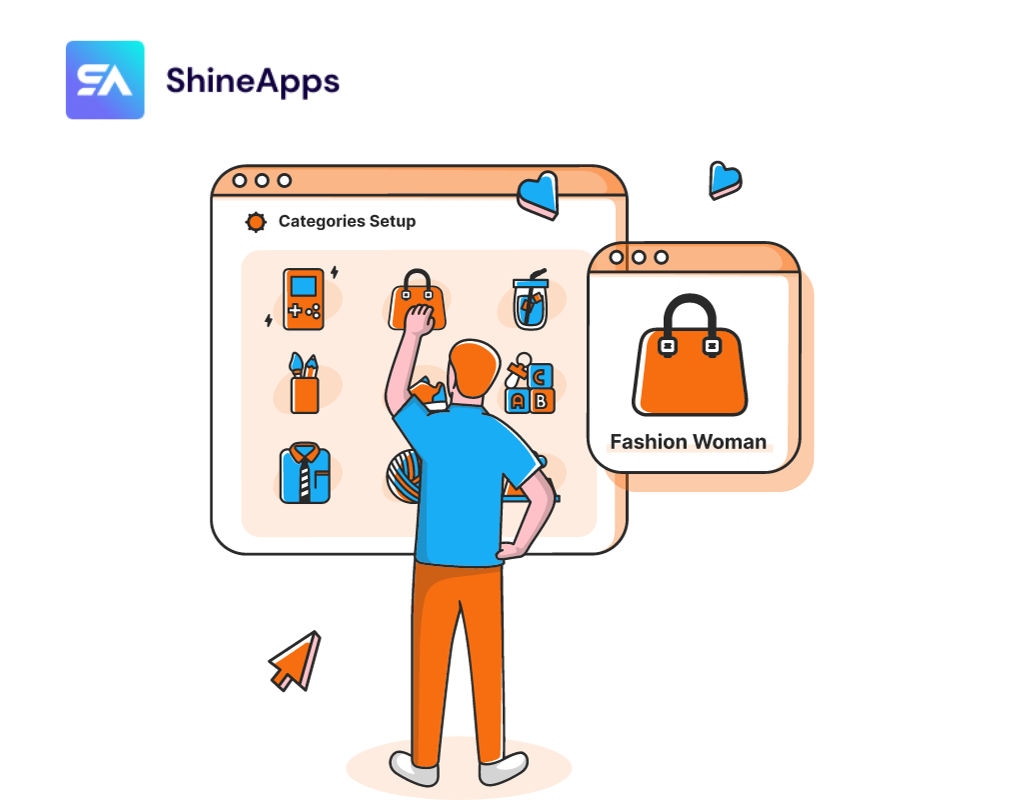
Examining how customers navigate categories and collections provides valuable insights. By identifying popular categories and studying where users tend to disengage or exit, you gain a deeper understanding of their interests.
This data can be used to tailor your content and product selection more effectively. When you know where users disengage, you can make informed improvements, whether that means refining your product offerings or enhancing the overall navigation experience to keep users engaged.
5. Conversion Patterns
Conversion patterns are another vital aspect that analytics can shed light on. By monitoring user behavior post-search or collection viewing, you can pinpoint which searches or collection views are resulting in successful conversions. This information is instrumental in refining your marketing strategies and optimizing product placement to drive more conversions.
For a deeper understanding of consumer behavior, consider evaluating product performance metrics, including:
- Revenue: The total income generated by a product through search.
- Order count: The number of orders that include a specific product resulting from searches.
- Conversion rate: The percentage of visitors who make a purchase or add the product to their cart after searching.
- Click count: The total number of clicks on a product via search.
6. Customer satisfaction

Customer satisfaction can be assessed through site search analytics by looking at two key indicators: search refinements and the number of searches per session. When users consistently refine their searches or conduct multiple searches within a session, it often signifies that they are encountering challenges in locating the products they seek.
This data highlights opportunities for enhancing the user experience and improving search functionality to ultimately boost customer satisfaction.
7. Seasonal or Trending Interests
Analyzing search and collection data over time allows you to spot emerging trends, seasonal interests, and shifts in customer preferences. This insight empowers you to proactively manage inventory, create relevant content, and tailor marketing campaigns to align with evolving customer demands.
For instance, brands like Red Dress excel at not only presenting related items but also implementing cross-selling strategies. They include sections showcasing complementary items that complete an outfit when a visitor views products like black and white plaid pants.
Once you’ve grasped these trends and customer preferences, consider incorporating product recommendations into your strategy. This offers customers more options and has the potential to boost Average Order Values (AOVs), enhancing both the customer experience and your bottom line.
8. User Path Analysis
User path analysis involves monitoring how users navigate your site after conducting a search or selecting a category. It sheds light on their browsing patterns and reveals the specific content or products they eventually interact with.
Furthermore, by examining the time users spend on particular search results or category pages, you can gauge their level of interest and engagement with the provided content. This data offers valuable insights into user behavior and preferences, helping you optimize your site for a better user experience.
Tips For Effectively Using Analytics And Other Features
Making the most of analytics and other features on your website or digital platform is crucial for improving user experience, increasing conversions, and achieving your business goals. Here are some tips to help you effectively utilize these tools:
- Set Clear Goals: Define specific objectives for using analytics and other features. What do you want to achieve? Whether it’s increasing sales, improving user engagement, or enhancing content relevance, having clear goals will guide your efforts.
- Regularly Review Data: Don’t just collect data; analyze it regularly. Look for patterns, trends, and anomalies. Understand how users are interacting with your site, which pages or products are popular, and where users are dropping off.
- Segment Your Audience: Segment your audience based on demographics, behavior, and other factors. This allows you to tailor content, marketing, and product recommendations to different user groups.
- A/B Testing: Use A/B testing to experiment with changes to your website, such as layout, copy, or design. This helps you understand what resonates best with your audience and can lead to data-driven improvements.
- Optimize for Mobile: Ensure that your website is mobile-friendly. Mobile traffic is significant, and optimizing for mobile users can improve both the user experience and SEO rankings.
- Use Heatmaps: Heatmap tools can show you where users are clicking, hovering, or scrolling on your site. This visual representation can help you identify areas of interest and potential issues.
- Implement User Feedback: Gather feedback from users through surveys, reviews, and social media. User feedback can provide qualitative insights that complement quantitative data from analytics.
- Monitor Site Speed: Slow-loading pages can lead to high bounce rates. Regularly monitor and optimize your website’s loading speed for a better user experience.
- Benchmark Against Competitors: Compare your website’s performance and user behavior metrics against competitors in your industry. This can reveal areas where you may need to catch up or innovate.
Conclusion
In conclusion, Site Search & Collection Analytics provide insight into the hearts and minds of your online shoppers. Through the lens of data, you can decode their preferences, track their journey, and adapt your strategies to meet their evolving needs. In the ever-evolving realm of e-commerce, knowledge is power, and these analytics are your gateway to success.

